|
YOUR RESIDENTIAL PROPERTY MANAGEMENT EXPERTS
|
|
| Whenever you see words that are underlined in blue, be sure to click on them as they are hyperlinks to the rest of an article or report. |
Kevin Chard Certified Negotiation Expert Designation
|
GRI, CRS, CRP - what does all this alphabet soup mean to you when you see it in print? When you see initials like these behind a REALTOR's name, it means that this person is a committed professional, not content just to take the courses needed to earn and maintain a real estate license, but determined to improve their professional skills. REALTOR's have devoted time to attending advanced educational courses and taking examinations to earn these designations to better serve their clients.

CNE: Certified Negotiation Expert - This designation is awarded by the Real Estate Negotiation Institute. An agent who carries the CNE® (Certified Negotiation Expert) designation has been trained in professional negotiation skills by Negotiation Expertise, LLC, the leading negotiation training and coaching company for real estate professionals in North America. A CNE® professional knows how to use leading edge negotiation practices and techniques for your benefit will be able to handle your real estate negotiations with skill and excellence.
We're proud that Kevin has received this designation in conjunction with his Accredited Buyer Representative (ABR), as it allows him to provide an enhanced and higher educated performance level with his Buyer partners. Kevin has been extremely busy this Spring and Summer assisting numerous residents transition from renting into home ownership. If you have any questions or would like to get started on this process feel free to reach out to him at Kevin Chard or call our office at 303-666-4300.
|
Where has all our inventory gone? I have several Buyers and Investors who would love to purchase real estate but are unable to presently do so as there just isn't enough property available in the market to enable them to make their purchasing decision. I have yet to meet an Investor, or even a homebuyer looking for a new primary home to live in, who is looking to SPEND their money over INVESTING it, and with such a small pool of attractive properties to choose from the purchasing process has stretched out over months. Low inventory still remains the primary dilemma in our Boulder County and Front Range market.
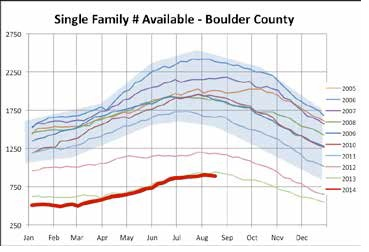
Above is a chart noting the sales figures for the amount of Single Family Homes sold in Boulder County from 2005-2014. Note the above Bell Curve is representative of the chart that I featured in our State of the Market Update entitled "Thinking About Selling This Spring?" last December. 2005-2011 shows a high degree of consistency year over year with accustomed seasonal variances, albeit with varying amounts of volume sold contingent upon the particular year. 2012 noted a steep drop off, followed by another substantial inventory decline in 2013 with 2014 following in lockstep if not worse.
While our inventory has been declining to historic lows our regional demand for inventory has continued to be strong, which has provided us our large inventory imbalance of high demand/low inventory resulting in our subsequent strong Seller's Market for the last 1 1/2+ years. Well maintained properties and homes that are priced supporting market expectations are selling quick, often with multiple offers at or over List Price. Properties that are priced above what the market will support will stagnate and not sell quickly. Buyers and Investors want to buy but are not showing that they are willing to overpay; which is positive and shows that we're not in an emotional bubble and that Buyers are being astute with their purchasing.
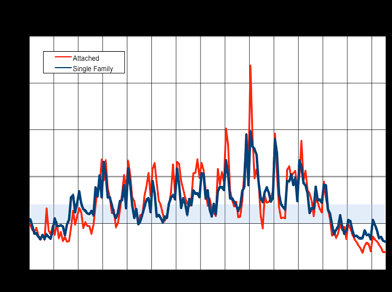
The below chart represents how Single Family Home sales are mimicking Condo/Townhome sales, where inventory pressure is not judgmental on the variety of home on the market. The vertical lines starting on the far left start at the year 2000, each vertical line to the right represents another year, so the far right abbreviated vertical line that makes up the border represents August 2014. The horizontal lines represent month of inventory, so the lowest vertical line is at 5 months, then the one above it is 10 months, up to increments of 5 months to top out at 25 months of inventory at the top of the margin. A healthy real estate market will support roughly 7 months of inventory, we're currently at about 50% of that figure.
SO, WHAT'S THE NET OF WHERE WE'RE CURRENTLY AT?
- We're in a strong seller's market and should expect to be for the next 2-3 years.
- Builders are creating more shelter, although it will take time to meet past inventory demand let alone keep pace with current inventory demand.
- Present a clean and well maintained home to the market and price it right, and you may find yourself in a bidding war shortly after going to market.
- Interest rates remain attractive to introduce new Buyers to the market.
- Rental rates have risen to the tipping point where a mortgage may be obtained on owning property that's close to existing rental rates.
- Lack of inventory is preventing some Sellers from selling their home, as selling their home isn't the problem; finding the right home to downsize or upsize to is.
- Same holds true for tenants, as available rental inventory mimics available purchasing inventory. Many tenants that could buy instead opt to retain their rental as their alternatives are minimal; making for a strong Landlord Market.
- If you're thinking about selling your property now, there are only seasonal variances of demand to contend with, demand will always be strong.
- Fall Winter draws out serious Buyers, as those who market their property at this time are serious about selling. Minimal amounts of "testing the water" scenarios.
- Fall and Winter seasons generally feature minimal in competition from your neighbors trying to sell their homes, although landscaping can be a challenge to feature as a differentiator for your property.
- Fall and Winter is a good time to develop your strategy and understand what needs to be done to optimize your Return On Investment when you do go to market in the Spring and Summer.
Interested in Boulder County's single family home, condo and townhome latest stats? Click on the August 2014 link to review the latest statistics just released by the Boulder Area Realtor Association. There are also Year-over-Year figures as well represented in the report. The continued good news is that our Average Days to Contract for both Homes and Condo's/Townhome's continue to decrease year over year, while Median Sales Price continues to increase year over year in virtually all of our Denver North Metro & Boulder markets.
If you're interested in selling your property and would like to explore your next steps, or would like me to provide you a Comparative Market Analysis for your property that will include projected market pricing and a Seller's Net Estimate sheet please be sure to contact Kevin Chard and he'll get right to work with you to provide you that reference material.
BARA The Review | September 2014
|
|
|
|
|
Copyright © 2014. All Rights Reserved.
|
|
|
|